
About Me
Hello! My name is Dominic Rinaldi and I'm a Data Analyst diligently pursuing a role in the career field. 👋🏼I have a background in various fields, such as analytics, business, coding, engineering, and psychology. 🧠I'm currently focused on creating reports and visualizations for data-forward companies as well as personal projects that further enhance my data skillset. 📖I put a major focus on collecting and analyzing data of various types to inform stakeholders of business decisions. 📈I'm eager to leverage my enthusiasm for working with data and using my skillsets to provide business insights and support strategic decision-making within a vibrant, data-focused company. 🤝
Skills
SQL | Excel | Tableau | Power BI | Python | R Studio
Data Analytics
Data Preparation
Report Development
Data Visualization
Relationship Tables
Public Communication
Featured Projects
RStudio | Tableau
Cyclistic Bike-Share Study
Analyzed bike-share customer data within RStudio in order to find ways to convert customers from casual riders to members. Visualizations are presented with Tableau.


Power Bi
CodeX Beverage Survey Dashboard
Finding ways to improve product quality and awareness for expansion into other cities through analysis of survey data.
Python
NBA Playoff Shooting Data Analysis
Using analysis of shooting data from the 2021 NBA playoffs to create recommendations for player improvement. These insights can, in turn, be adapted to players of other teams.

RStudio | Tableau
Cyclistic Bike-Share Study
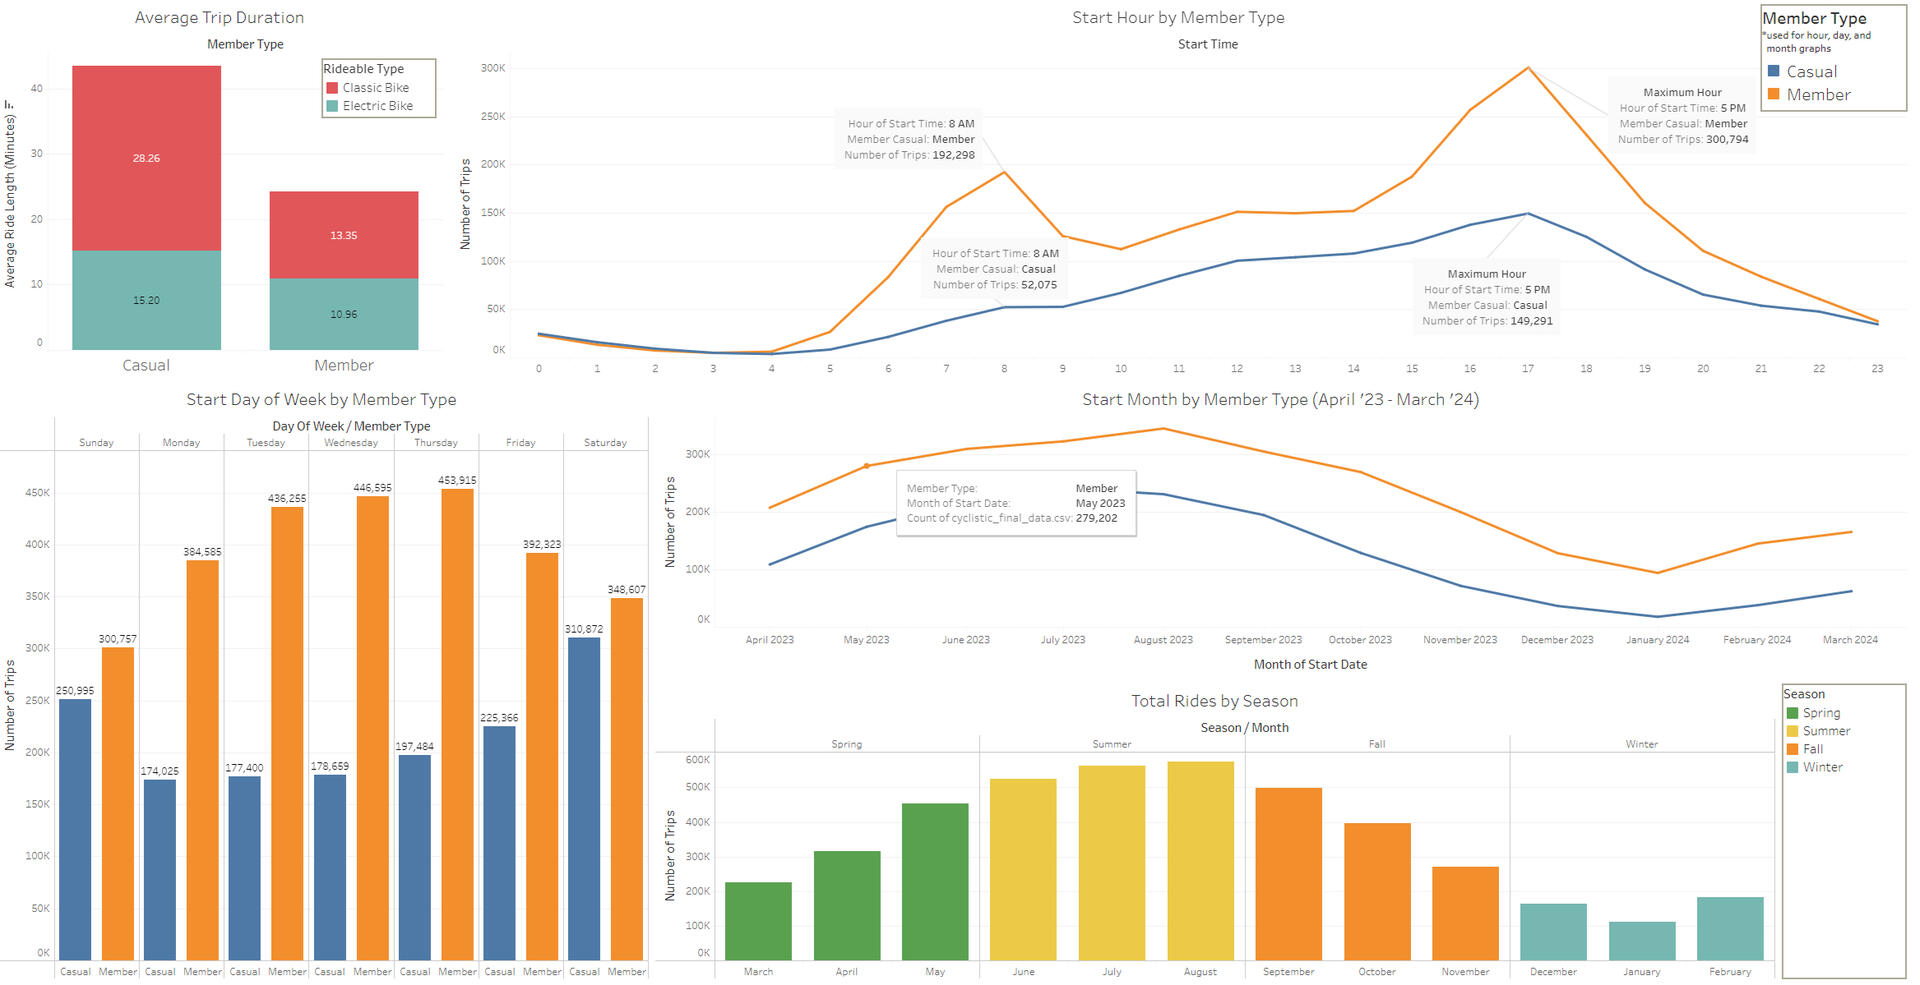
Cyclistic is a bike-share company located in Chicago looking to find ways to increase revenue by converting casual riders into members. This project focuses on data collected from April 2023 - March 2024.Here is the business question asked of me:
How do annual members and casual riders use Cyclistic bikes differently?The following steps were done to create my analysis:
1) Taking the datasets from the previous 12 months (at the time), combining them into one dataset, cleaning it, and preparing it for analysis.
2) Creating functions and calculating totals, modes, and ride lengths for various variables.
3) Creating interactive charts and graphs that represent the importance of different variables within the dataset.
4) Organizing the visualizations into their respective dashboards.
5) Formatting each section of the final dashboard and creating a theme for presentation.Here are some key takeaways:
1) Members make up about 2/3 of the ride totals while casual riders are closer to 1/3.
2) Members prefer to ride more inland while casual riders prefer to ride closer to the water.
3) Members have shorter average trip durations than casual riders.
4) Members saw a general trend of more rides during the week, as opposed to casual riders seeing more trips during the weekend.
5) Both groups show busiest ride times during the summer around 5pm and preferred classic bicycles over electric bicycles.Check out my article detailing this project here!
Power bi
COdex beverage survey dashboard
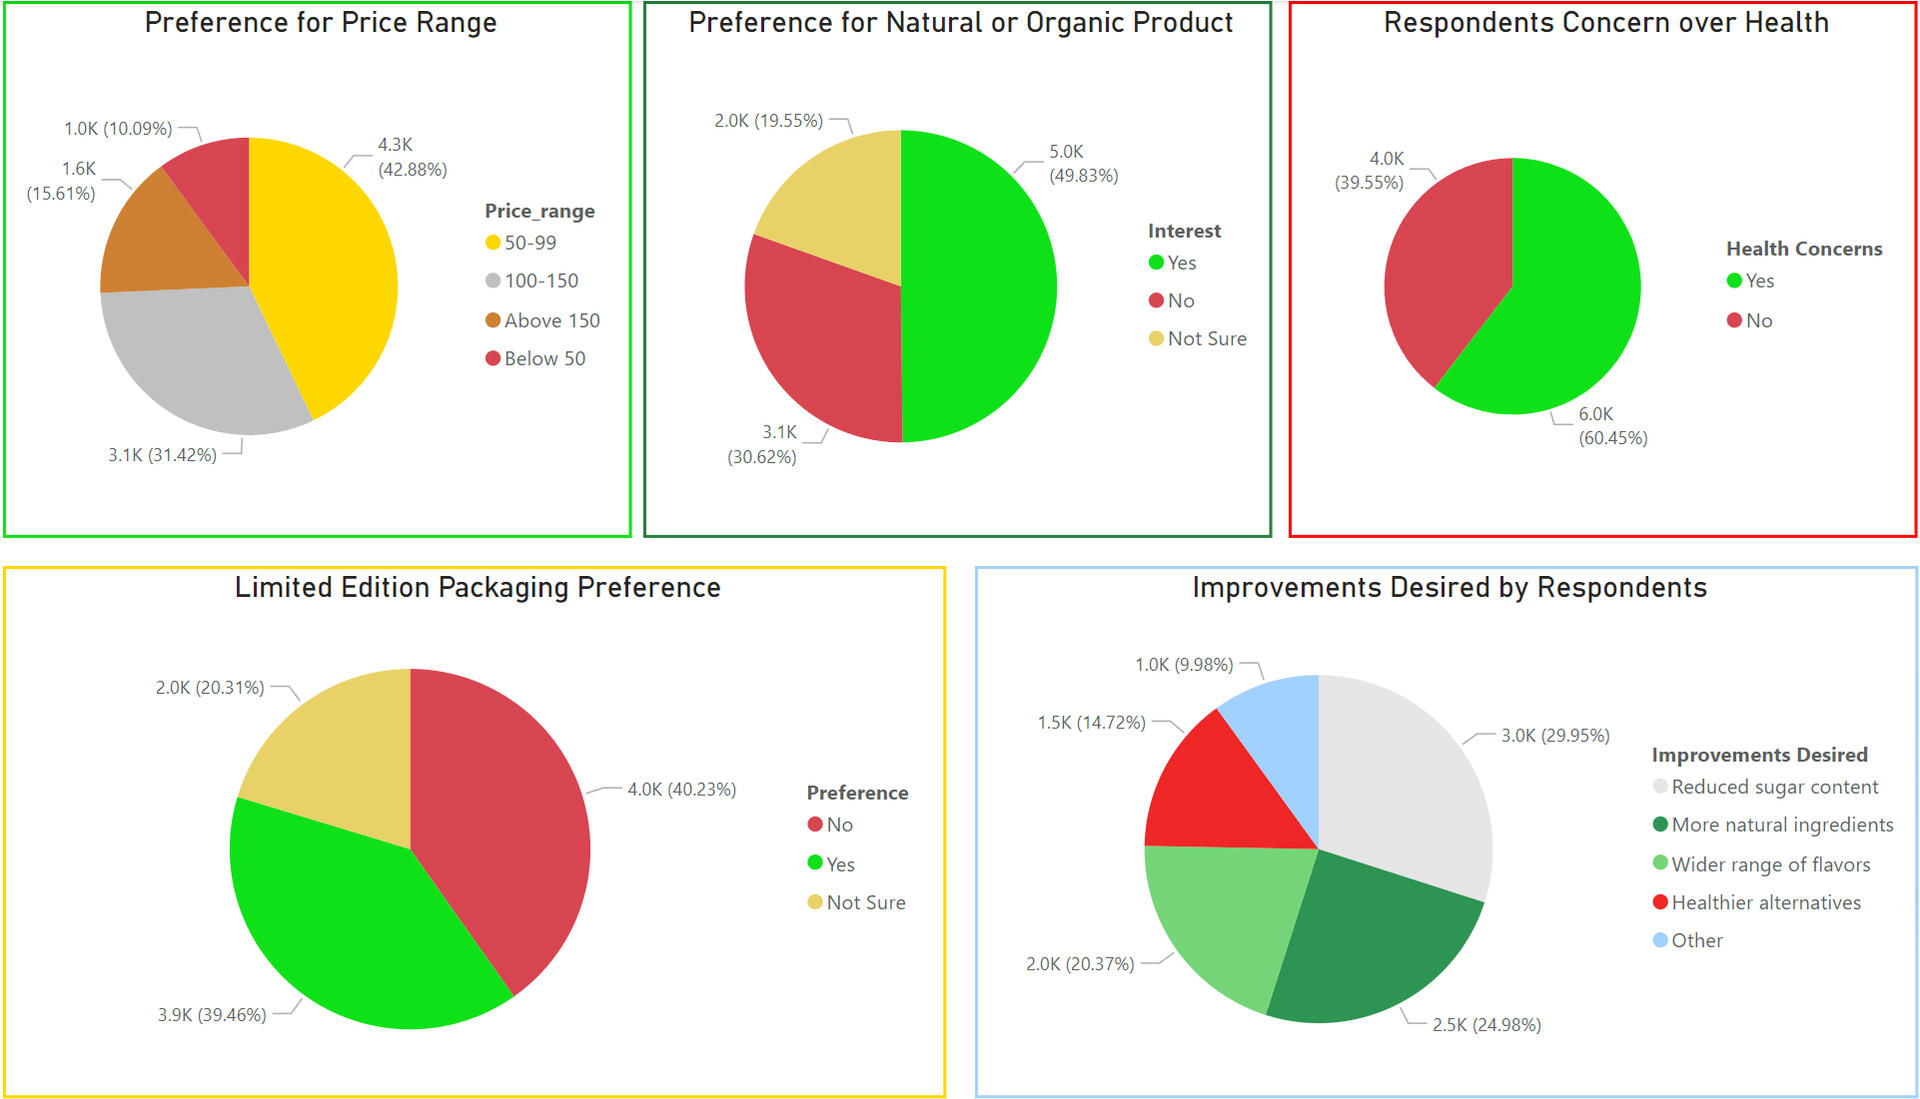
CodeX is a German beverage company that is looking to expand into the markets of India. After launching their drink in 10 different Indian cities, a survey was conducted from 10,000 participants.Here is the business task asked of me:
Convert the survey results into meaningful insights that the team can use to push further actions.The following steps were done to create my analysis:
1) Taking the survey results dataset and cleaning it
2) Creating and calculating key measures for different variables to be used in analysis.
3) Creating interactive charts and graphs that represent the responses of the survey.
4) Organizing the visualizations into their respective dashboards and ordering them by types of insights (demographics, consumer preferences, etc.).
5) Formatting each section of the dashboards to clearly represent survey responses.Here are some key takeaways:
1) The primary target audience are athletic and healthier males, aged 19-30, living in Bangalore, Hyderabad, or Mumbai.
2) Some immediate improvements include incorporating more natural/organic ingredients, reducing sugar, and prioritizing brand reputation, taste quality, and product availability in supermarkets.
3) The ideal price of the product would be in the higher end of the 50-99 Rupee range.
4) Marketing should be focused on online ads and television commercials.Check out my article detailing this project here!
Python
NBA Playoff Shooting Data Analysis
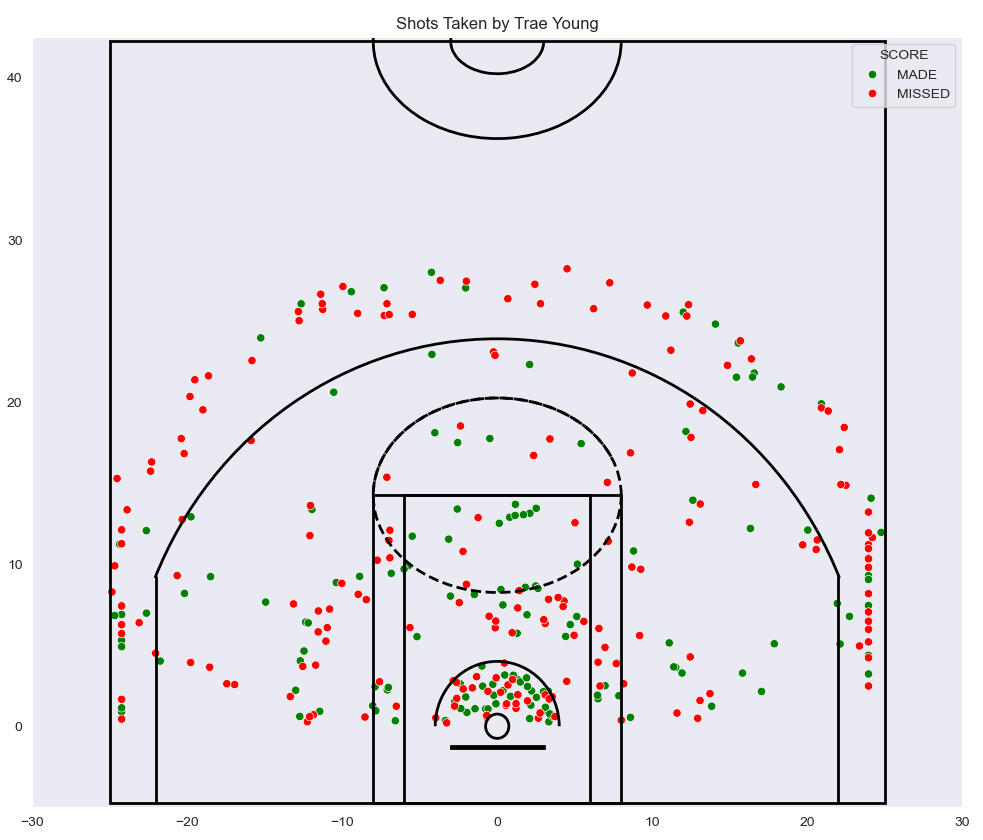
This dataset comprised by DataCamp and sourced from the National Basketball Association (NBA) involves shooting data from four different NBA players during the 2021 playoffs.Here is the business task asked of me:
Use past NBA shooting data to provide recommendations that are tailored to different players.The following steps were done to create my analysis:
1) Loading and exploring the data in order to check for errors or nulls.
2) Creating different variables and dataframe columns that will be useful for analysis.
3) Making a function that draws a basketball court chart that will be used for visualizations.
4) Using variables and calculations to create visualizations to answer various questions.
5) Using the visualizations to provide recommendations and other insights from the data.Here are some key takeaways:
1) Seth Curry is the most efficient shooter while Russell Westbrook is the most efficient defender.
2) On the opposite end, Russell Westbrook is the least efficient shooter and Trae Young is the least efficient defender.
3) Each player has specific improvements for different field goals zones both offensively and defensively that could be improved.
4) The data insights could benefit from a more advanced analysis, one involving predictive models and possibly even AI generations.Check out my article detailing this project here!